RUNMAPR
RUNMAPR is currently a WIP. I’m hoping to launch the MVP soon after a summer of building. I already have a backlog of new features I want to add, and will add in upcoming releases - but you have to draw the line at some point for the launch. I hope that the app is a delight to any runner who manages to discover it. :D

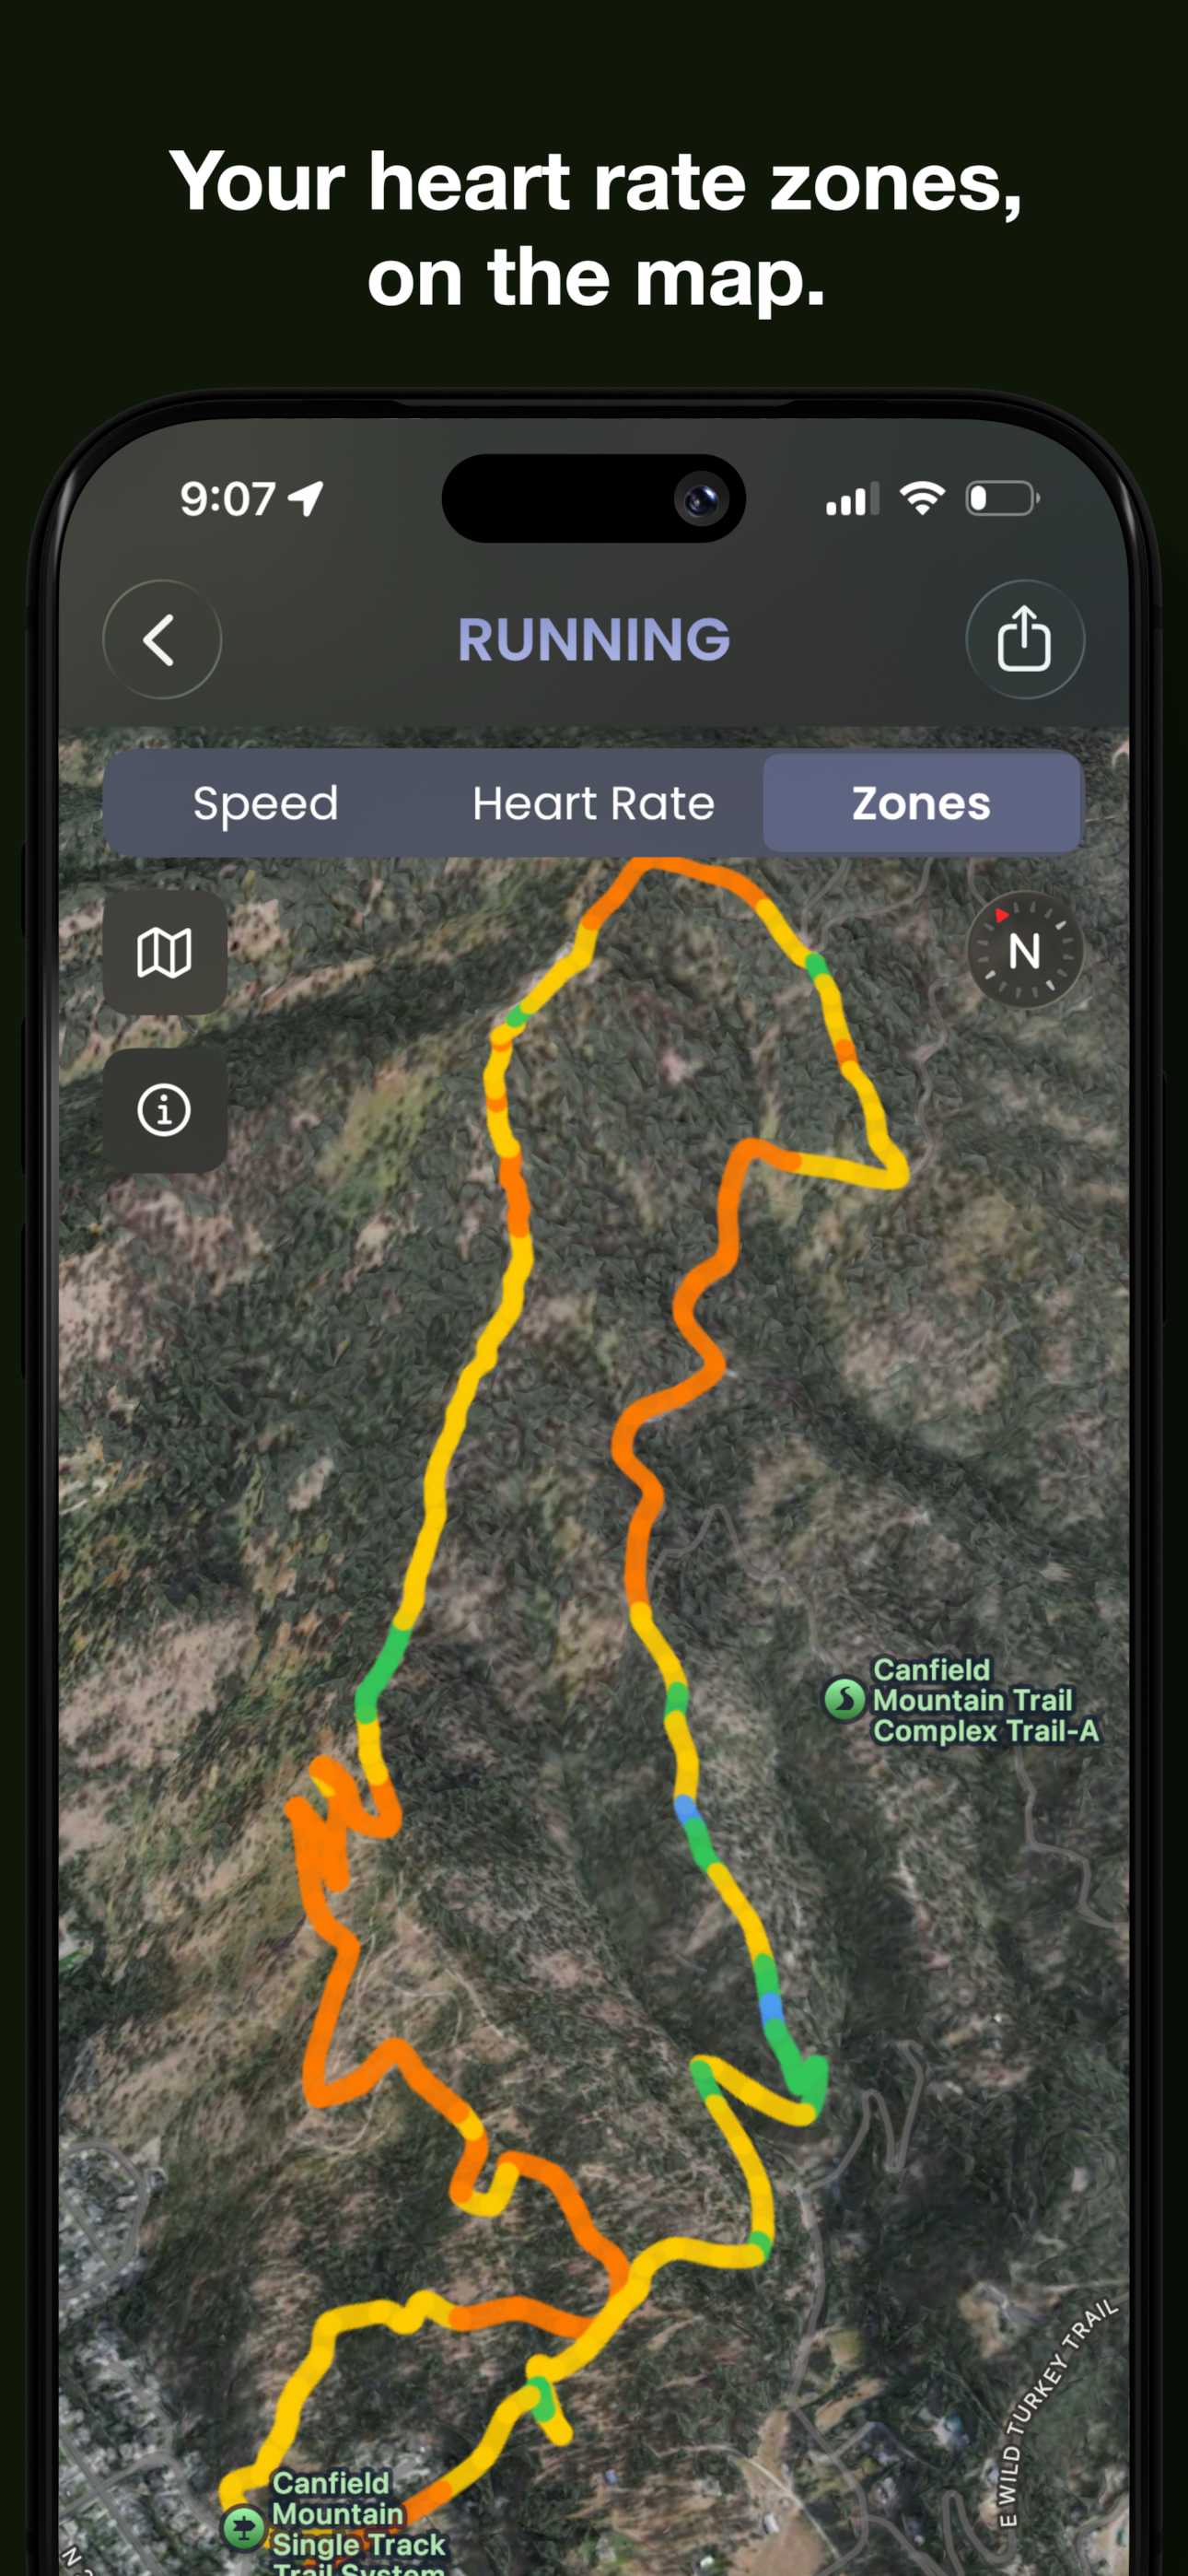
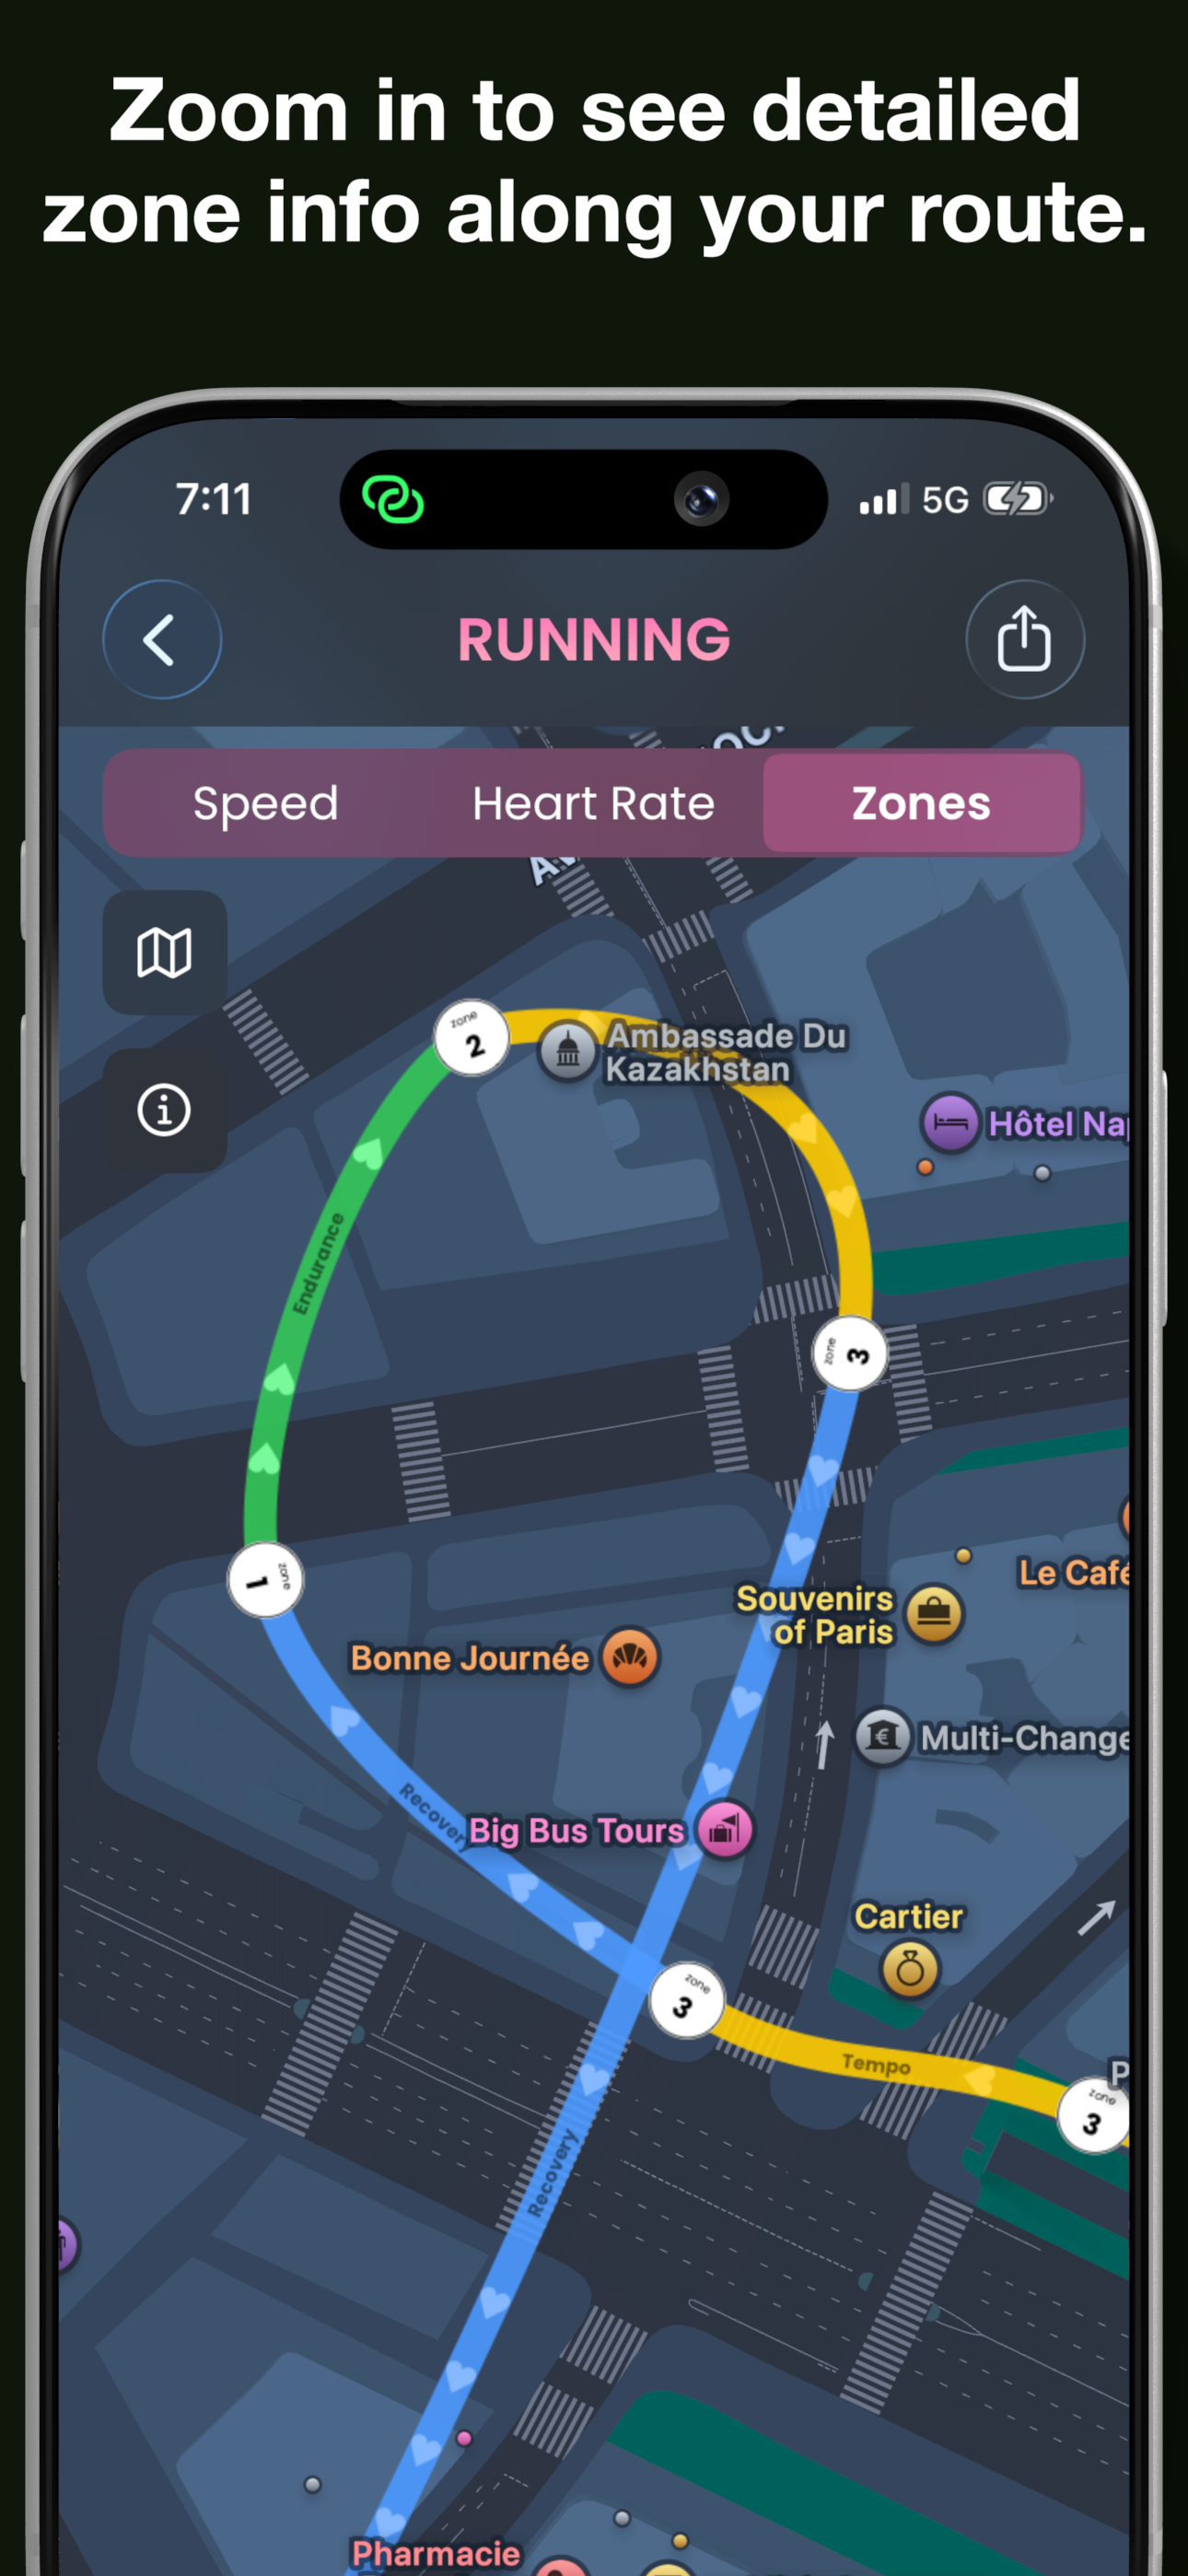
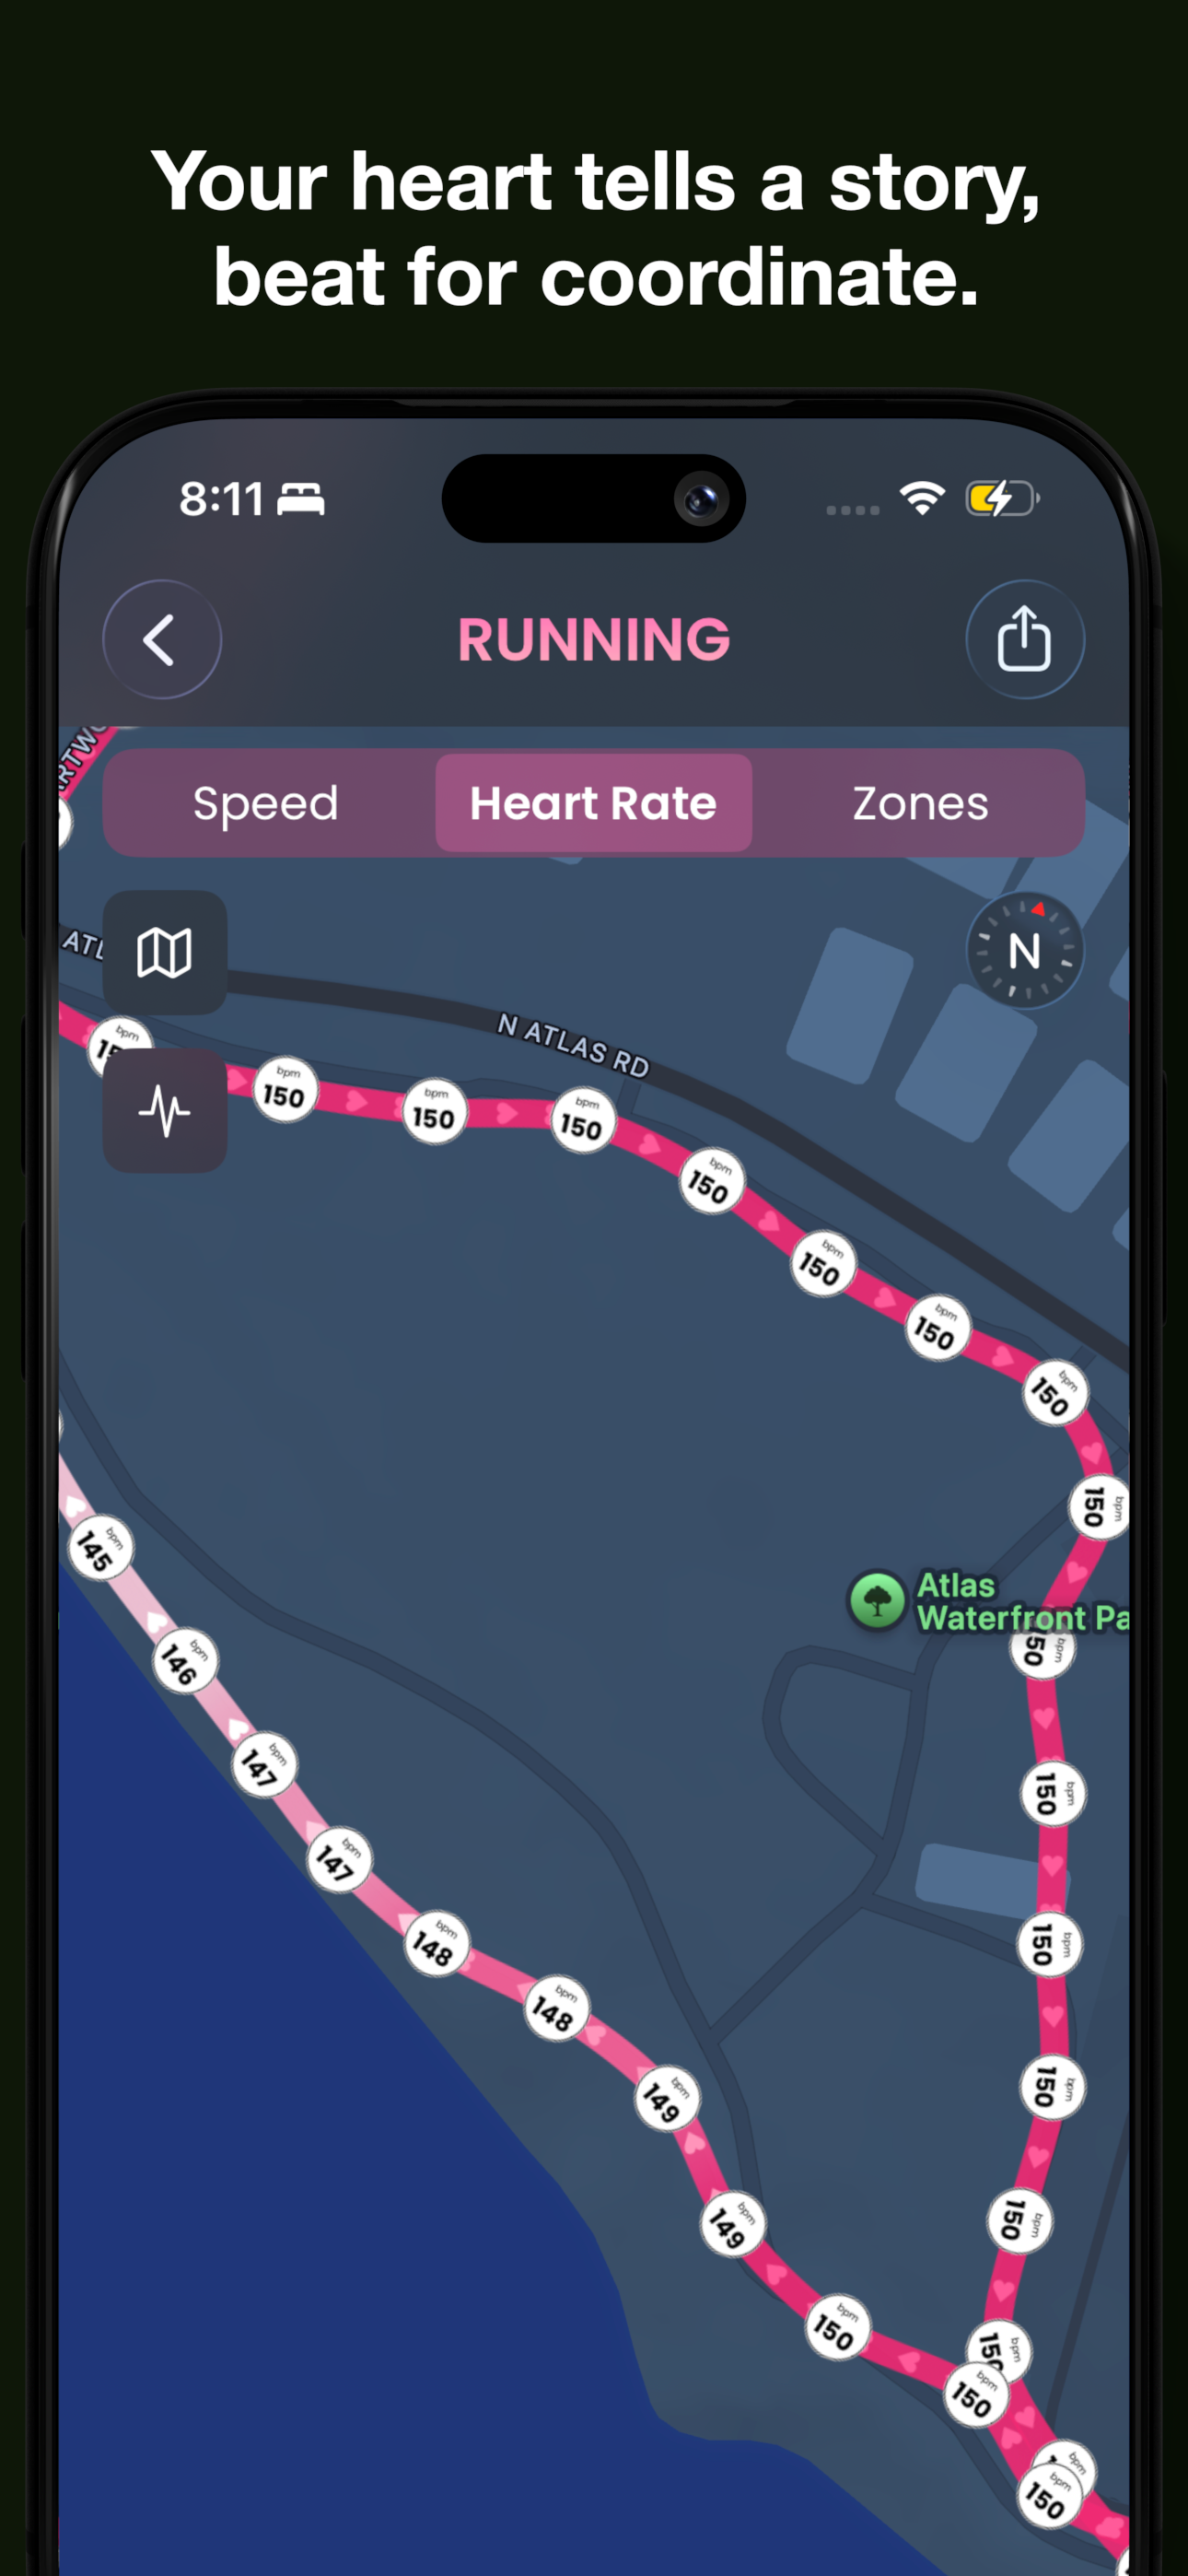
I was inspired to build RUNMAPR after earnestly attempting to increase the amount of time I spent training in Zone 2. I found pacing myself to stay in Zone 2 was surprisingly difficult and required a lot of restraint. Sometimes I’d pop into a higher heart rate zone during my run without noticing until it I started to feel a bit short of breath. When I was reflecting on my runs, I started wondering what environmental conditions prompted the change in heart rate - did I start running up a gradual hill? Was I stressed out and moving more quickly through an intersection? Most apps would only give me a window into the cumulative time I had spent in each zone, but failed to answer the deeper questions of what was triggering me to move into a higher heart rate zone on my run.
I thought it could be illuminating to see my exact zone transitions on the map - to get a better feel for when I transitioned between zones and refine my pacing strategy for those supposed-to-be-easy runs.
Since most fitness trackers gather timestamped heart rate data when you’re running - I figured it would be easy enough to zip the heart rate and coordinate data together and render heart rate along the route.
Since zones are derived from your heart rate, making the leap from displaying heart rate to showing zones on the map was easy enough.
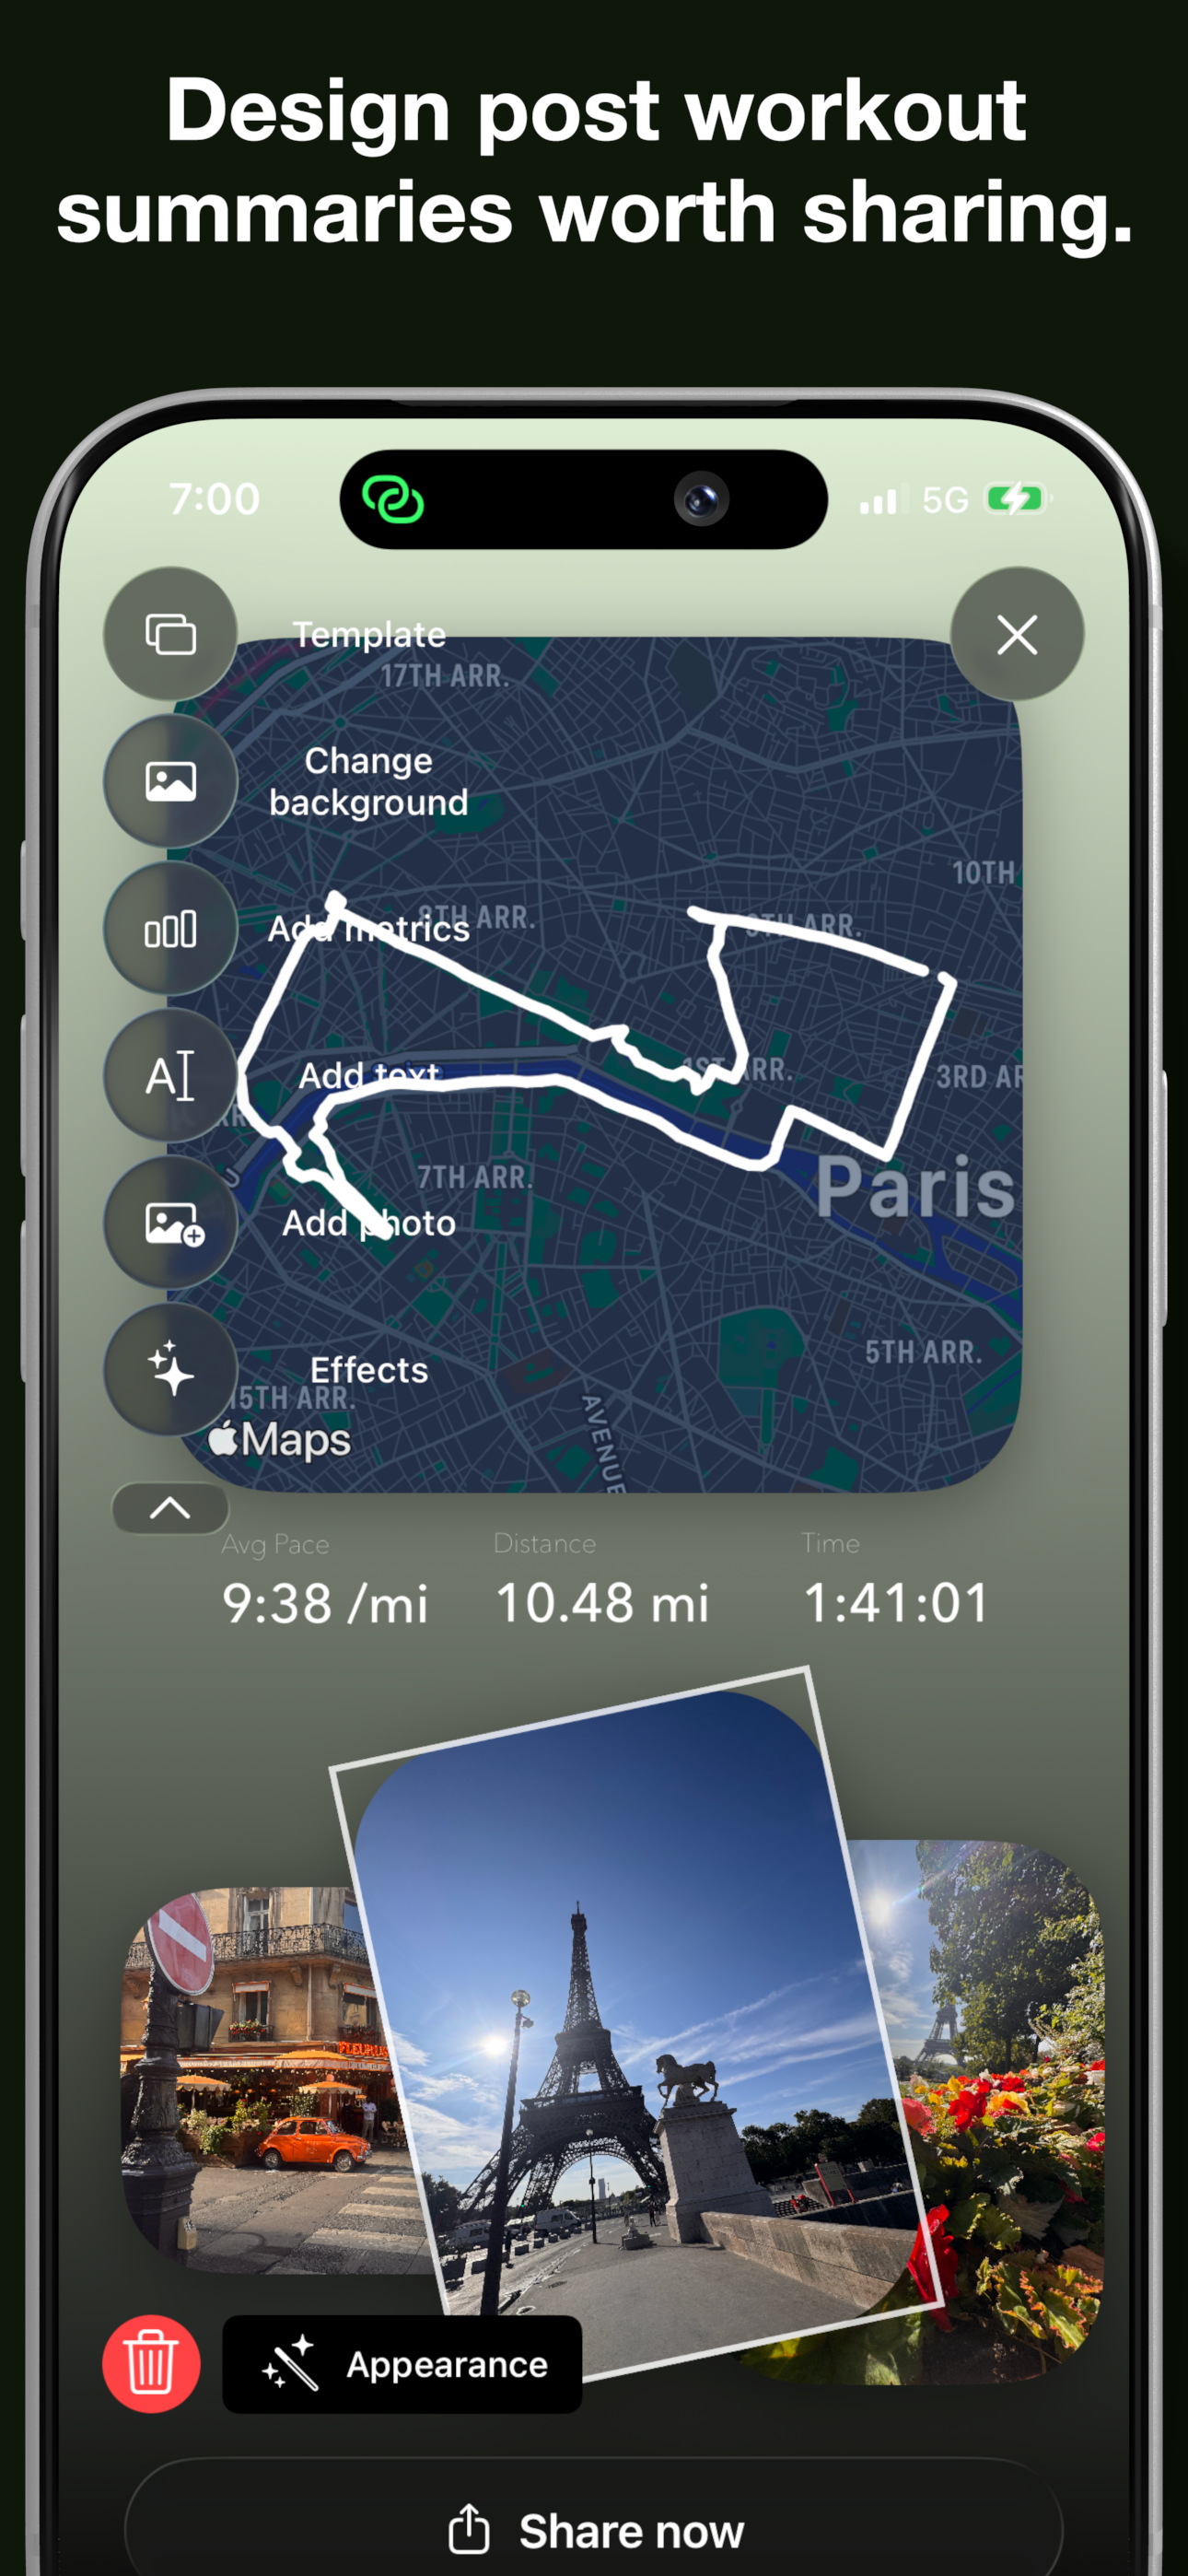
In addition to zone information, I wanted an app that provided a richer, more interesting way of constructing post workout summaries to share on Strava or other social media sites. It’s superficial - I know, but what better way to celebrate your run than with beautiful summaries you can construct yourself?
You can add and arrange photos you took during your run with the map of your route - alongside other stats such as pace, distance and duration. You can also add custom text - and personalize every aspect of the image - from the background to the text color.
Run fast. Run far. Run free :]